All 15 results
Sort by
Best selling Mastering Spark with R notes
-
Week 14
- Summary • 3 pages • 2023 Popular
- $10.49
- 2x sold
- + learn more
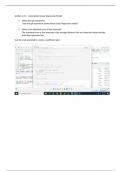
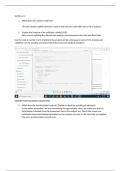
Using the code in section 4.4.1, create a generalized linear regression model. Extract the coefficient estimates into a tidy dataframe. ANSWER THE FOLLOWING QUESTIONS: 1. What does glr represent? 2. What is the standard error of the intercept? Use the code provided to create a coefficient plot. ANSWER THE FOLLOWING QUESTIONS: 3. Which two coefficients have the tightest confidence intervals. 4. Why does the y axis appear on the bottom of the chart while the x axis is on the left side? Us...
-
Week 11
- Summary • 4 pages • 2023 Popular
- $10.49
- 1x sold
- + learn more
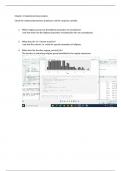
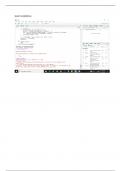
Continue to use the code in Chapter 4 to look at the relationship between predictors and the response variable. ANSWER THESE QUESTIONS: 1. Which religious group has the highest proportion of unemployed? 2. What does the 'se' column stand for? 3. What does the function regexp_extract() do? 4. Which ethnicity has the highest proportion of unemployed? Use the code provided to create a box plot of religion v. unemployed. ANSWER THE FOLLOWING QUESTIONS: 5. What does the box plot s...
-
Week 8
- Summary • 4 pages • 2023 Popular
- $10.49
- 1x sold
- + learn more
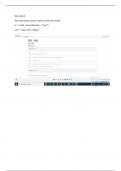
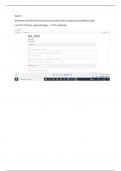
The text is Mastering Spark with R. Making sure that you are using the sc connection and the correct version of Java, install the ggplot2 library. Run the following code: >car_group <- cars %>% + group_by(cyl) %>% + summarize(mpg = sum(mpg, =true)) + collect() %>% + print() Using similar code determine the average mpg for each cylinder count. Plot both results using the following code: >ggplot(aes(r(cyl), mpg), data = car_group) + geom_col(fill = #) + coord_flip...
Do you also write study notes yourself? Put them up for sale and earn every time your document is purchased.
-
Week 4
- Summary • 5 pages • 2023 Popular
- $10.49
- 1x sold
- + learn more
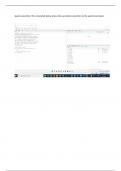
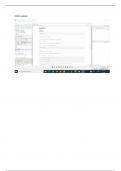
Use the correct command to show the Spark Web interface with the first tab selected. Submit a Word document with a screen shot of your Spark Jobs page showing a timestamp from your computer.
-
Week 13
- Summary • 4 pages • 2023 Popular
- $10.49
- 1x sold
- + learn more
Using the code in section 4.4 create 10 subsets of the okc_train data set. Create an analysis set and an assessment set, ANSWER THE FOLLOWING QUESTION: 1. What does sdf_random_split() do? 2. Explain the function of (rbind, vfolds[2:10]) Use the code in section 4.4 to transform the analysis set by scaling age in each of the training and validation sets by creating a function that finds mean and standard deviation. ANSWER THE FOLLOWING QUESTIONS: 3. What does the function(data) code do? Ex...
-
Week 2
- Summary • 3 pages • 2023 Popular
- $10.49
- + learn more
Following the instrutions in the book, install the sparklyr library and a Spark cluster on your local machine. The instructions in the book contemplate that you will be using Windows. If you are not running Windows, use a virtual machine. If you are using your employer's equipment, you may enounter a trusted domain error. This will also require that you install a virtual machine. The code in the book assumes Spark version 2.3 and Java 8. You are free to use any version, of course, but the co...
-
Week 9
- Summary • 3 pages • 2023 Popular
- $10.49
- + learn more
The text is Mastering Spark with R. Using your sc connection and the correct Java version: 1. explain what each element is doing in the following code blocks and the difference between these two code blocks that explains the difference in the output. Explain what the output tables mean: >cars %>% + ml_linear_regression(mpg ~ .) %>% + summary() >cars %>% + ml_linear_regression(mpg ~ hp + cyl) %>% + summary() cars %>% + ml_linear_regression(mpg ~ ...

-
Week 1
- Summary • 1 pages • 2023 Popular
- $10.49
- + learn more
Submit a Word or .pdf document with screen shots of R Studio where you have created a vector of three words. Whenever you are asked to submit a screenshot, include either a sliver of your desktop or a timestamp from your desktop. Always repeat the question you are answering.
-
Week 3
- Summary • 2 pages • 2023 Popular
- $10.49
- + learn more
The text is Mastering Spark with R. After installing the dplyr library, use the following code in R studio, create a scatter plot of hp v. mpg cars2 <- copy_to(sc, mtcars) cars3 <- (cars2) cars4 <- select(cars3, hp, mpg) cars5 <- sample_n(cars4, 32) cars6 <- collect(cars5) plot(cars6)
-
Week 10
- Summary • 3 pages • 2023 Popular
- $10.49
- + learn more
Follow the instructions in the book in Chapter 4 to read in the okc data. Explain what each element in the code is doing. Glimpse() the data. ANSWER THESE QUESTIONS; 1.What is the data type of the essay fields? 2.What do they contain? 3.How do you know the data is in Spark? Continue to use the code in Chapter 4 to add a response variable. ANSWER THESE QUESTIONS: 4. What is the response variable added? 5. Explain how the response variable is aggregated. 6. What is the tally? Continue t...
Newest Mastering Spark with R summaries
-
Week 14
- Summary • 3 pages • 2023 New
- $10.49
- 2x sold
- + learn more
Using the code in section 4.4.1, create a generalized linear regression model. Extract the coefficient estimates into a tidy dataframe. ANSWER THE FOLLOWING QUESTIONS: 1. What does glr represent? 2. What is the standard error of the intercept? Use the code provided to create a coefficient plot. ANSWER THE FOLLOWING QUESTIONS: 3. Which two coefficients have the tightest confidence intervals. 4. Why does the y axis appear on the bottom of the chart while the x axis is on the left side? Us...
-
Week 11
- Summary • 4 pages • 2023 New
- $10.49
- 1x sold
- + learn more
Continue to use the code in Chapter 4 to look at the relationship between predictors and the response variable. ANSWER THESE QUESTIONS: 1. Which religious group has the highest proportion of unemployed? 2. What does the 'se' column stand for? 3. What does the function regexp_extract() do? 4. Which ethnicity has the highest proportion of unemployed? Use the code provided to create a box plot of religion v. unemployed. ANSWER THE FOLLOWING QUESTIONS: 5. What does the box plot s...
-
Week 4
- Summary • 5 pages • 2023 New
- $10.49
- 1x sold
- + learn more
Use the correct command to show the Spark Web interface with the first tab selected. Submit a Word document with a screen shot of your Spark Jobs page showing a timestamp from your computer.
Do you also write study notes yourself? Put them up for sale and earn every time your document is purchased.
-
Week 13
- Summary • 4 pages • 2023 New
- $10.49
- 1x sold
- + learn more
Using the code in section 4.4 create 10 subsets of the okc_train data set. Create an analysis set and an assessment set, ANSWER THE FOLLOWING QUESTION: 1. What does sdf_random_split() do? 2. Explain the function of (rbind, vfolds[2:10]) Use the code in section 4.4 to transform the analysis set by scaling age in each of the training and validation sets by creating a function that finds mean and standard deviation. ANSWER THE FOLLOWING QUESTIONS: 3. What does the function(data) code do? Ex...
-
Week 8
- Summary • 4 pages • 2023 New
- $10.49
- 1x sold
- + learn more
The text is Mastering Spark with R. Making sure that you are using the sc connection and the correct version of Java, install the ggplot2 library. Run the following code: >car_group <- cars %>% + group_by(cyl) %>% + summarize(mpg = sum(mpg, =true)) + collect() %>% + print() Using similar code determine the average mpg for each cylinder count. Plot both results using the following code: >ggplot(aes(r(cyl), mpg), data = car_group) + geom_col(fill = #) + coord_flip...
-
Week 5
- Summary • 4 pages • 2023 New
- $10.49
- + learn more
The text is Mastering Spark with R. Create a new connection to your Spark cluster -. sc Make sure that you are using the correct version of Java Execute the following code: >summarize_all(cars, max) >summarize_all(cars, min) >summarize_all(cars, mean) >summarize_all(cars, mean)%>% show_query() >cars %>% mutate(transmission = ifelse(am ==0, "automatic", "manual")) %>% group_by(transmission) %>% summarize_all(mean)
-
Week 10
- Summary • 3 pages • 2023 New
- $10.49
- + learn more
Follow the instructions in the book in Chapter 4 to read in the okc data. Explain what each element in the code is doing. Glimpse() the data. ANSWER THESE QUESTIONS; 1.What is the data type of the essay fields? 2.What do they contain? 3.How do you know the data is in Spark? Continue to use the code in Chapter 4 to add a response variable. ANSWER THESE QUESTIONS: 4. What is the response variable added? 5. Explain how the response variable is aggregated. 6. What is the tally? Continue t...
-
Week 12
- Summary • 4 pages • 2023 New
- $10.49
- + learn more
Using the code in section 4.3 to scale the age variable. ANSWER THE FOLLOWING QUESTIONS: 1. Explain what the mutate function is doing in this line of code: mutate(scaled_age = (age - !!scale_values$mean-age) / !!scale_values$sd_age) 2. What do the two exclamation marks next to each other do? Use the code in the book to create a histogram of Scaled Age ANSWER THESE QUESTION: 3. Approximately how many profiles in the training set fall in the 0 bin? Using the code in section 4.3, aggregat...
-
Week 3
- Summary • 2 pages • 2023 New
- $10.49
- + learn more
The text is Mastering Spark with R. After installing the dplyr library, use the following code in R studio, create a scatter plot of hp v. mpg cars2 <- copy_to(sc, mtcars) cars3 <- (cars2) cars4 <- select(cars3, hp, mpg) cars5 <- sample_n(cars4, 32) cars6 <- collect(cars5) plot(cars6)
-
Week 15
- Summary • 3 pages • 2023 New
- $10.49
- + learn more
Using the code provided in section 4.5.1 AND 4.5.2, create an LDA model of the essays in the okc dataset. Create charts of most common terms per topic. ANSWER THE FOLLOWING QUESTIONS: 1. Explain how the html tags and newline characters were removed from the text. 2. How were the individual words combined into complete essays? 3. Explain what an LDA model does. 4. What are stop words? 5. In which 2 topics is the word 'want' not in the top ten? 6. What code snippet causes the topics...
