Popular courses 'Spreadsheets for Business Analytics' at Spreadsheets for Business Analytics
Spreadsheets for Business Analytics Study guides, Class notes & Summaries
Looking for the best study guides, study notes and summaries about Spreadsheets for Business Analytics? On this page you'll find 6 study documents about Spreadsheets for Business Analytics.
All 6 results
Sort by

-
Spreadsheets_for_Business_Analytics_Week15_ExcelSolver
- Exam (elaborations) • 2 pages • 2024
- $10.49
- + learn more
Solver Using your own problem find an optimization solution. Maybe you want to maximize the profit of your sewing operation that makes pants and shirts. Maybe you want to find the optimum balance of stocks in your portfolio. Or, maybe you want to come up with your own example. Submit a Word document with your explanation, in 500 words or more, of how you used Solver to answer your business question. Include screenshots of your work (with the desktop slice, of course). Note: This document is...
-
Spreadsheets_for_Business_Analytics_Week14_LinearRegression
- Exam (elaborations) • 2 pages • 2024
- $10.49
- + learn more
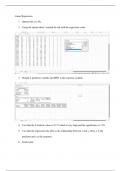
Linear Regression Open the attached .csv file. Select Regression from the data analysis tab Weight will be our predictor variable and MPG the response variable. Select your x (predictor) and y (response) ranges accordingly. Check the labels button and and output cell. Observe the ANOVA matrix. The F-statistic will tell you whether your model is better than simply using the mean. You will want the F-statistic to be as high as possible and the significance to be as low as possible. The equati...

-
Spreadsheets_for_Business_Analytics_Week13_RFMAnalysis
- Exam (elaborations) • 3 pages • 2024
- $10.49
- + learn more
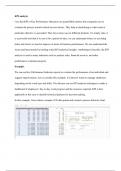
According to , RFM analysis is a marketing technique used to quantitatively rank and group customers based on the recency, frequency and monetary total of their recent transactions to identify the best customers and perform targeted marketing campaigns. Using your own dataset, execute an RFM analysis and explain your analysis and your findings in 500 words or more. Note: This document is for learning purposes only.
-
Spreadsheets_for_Business_Analytics_Week12_KPIAnalysis
- Exam (elaborations) • 3 pages • 2024
- $10.49
- + learn more
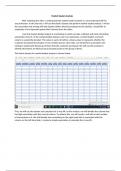
KPI analysis using process behavior/control charts and this video with an example business process behavior chart. Note that Langer uses a natural end to the time series (end of year) to allow him to create two process charts which can be compared, as well. Read the attached document showing how to create and analyze the process control chart. Using your own choice of dataset and what you have learned from the video use a KPI analysis to learn about your data set. Discuss in 500 words or more, w...
-
Spreadsheets for Business ASpreadsheets_for_Business_Analytics_Week11_MarketBasketAnalysisnalytics
- Exam (elaborations) • 3 pages • 2024
- $10.49
- + learn more
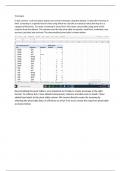
Market Basket Analysis. Using what you have learned use Market Basket Analysis to mine association rules from your own data set. Discuss in 500 words or more, what patterns in association rules reveal about your business question. Share the business question you are attempting to answer. Submit a Word document with screenshots of your Market Basket Analysis including your use of the Solver and your discussion. Always include a slice of your desktop with any screenshot. Note: This document i...

Too much month left at the end of the money?

-
Spreadsheets_for_Business_Analytics_Week10_Treemaps
- Exam (elaborations) • 3 pages • 2024
- $10.49
- + learn more
Treemaps Using what you have learned create treemaps visualizing data from your data set. Discuss, in 500 words or more, what the treemaps reveal about your business question. Share the business question you are attempting to answer. Submit a Word document with screenshots of your treemaps and your discussion. Always include a slice of your desktop with any screenshot, Please note that all code assignments must be submitted as a screenshot with a slice of your desktop showing the timestamp....
