Scatter plot Study guides, Class notes & Summaries
Looking for the best study guides, study notes and summaries about Scatter plot? On this page you'll find 1105 study documents about Scatter plot.
All 1.105 results
Sort by
 Popular
-
MIP2602 assignment 4 (DETAILED ANSWERS) 2023 (225269) -DUE 25 August 2023
- Exam (elaborations) • 20 pages • 2023
- $2.71
- 18x sold
- + learn more
MIP2602 assignment 4 (DETAILED ANSWERS) 2023 () -DUE 25 August 2023 100% TRUSTED workings, explanations and solutions. For assistance call or whatsapp us on +25477 954 0132 . Question 1 1.1 What type(s) of data are best for using the following? 1.1.1 A stem-and-leaf plot (2) 1.1.2 A bar chart (2) 1.1.3 Pie chart (2) 1.1.4 Scatter plot (2) 1.1.5 Line graph (2) 1.1.6 A histogram (1) 1.1.7 Box-and-whisker plot (1) 1.2 How is the bar graph better than the pictograph? (4) 1.3 Whe...
 Popular
-
ENG1517 JAN/FEB Supplementary exam 2024 Answers
- Other • 9 pages • 2024 Popular
- $2.74
- 6x sold
- + learn more
ENG1517 JAN/FEB Supplementary exam 2024 Answers SECTION A ALL the answers in this section MUST be presented in the form of (a) cohesive paragraph/s and not in point form. After you have read TEXT A, please answer Questions 1.1 to 1.3. Hairy Maclary from Donaldson’s Dairy is a cumulative tale. The full text of the story has been copied below and an example of one of the pictures has been provided. Most of the paragraphs of text appear alone on a page next to an illustration, as in...
-
WGU C215 Operations Management PVDC Final Exam Questions and Answers Graded A
- Exam (elaborations) • 18 pages • 2022
- $9.49
- 23x sold
- + learn more
WGU C215 Operations Management PVDC Final Exam Questions and Answers Graded A Which definition is used for quality, evaluates how well a product performs its intended function? Fitness for use 14 points for quality improvement Which total quality management (TQM) process was developed to stress management's responsibility for quality? ISO 9000 Set of international standards on quality management and quality assurance, critical to international business -TQM process consists of 13 published s...

-
Gizmo Scatter plot Answer Key./Trends in Scatter Plots Answer Key
- Exam (elaborations) • 8 pages • 2023
- $9.89
- + learn more
Gizmo Scatter plot Answer Key./Trends in Scatter Plots Answer Key Vocabulary: correlation, scatter plot, slope, trend line, y-intercept Prior Knowledge Questions (Do these BEFORE using the Gizmo.) [Note: The purpose of these questions is to activate prior knowledge and get students thinking. Students who do not already know the answers will benefit from the class discussion.] A school nurse records the age and height of each student she sees in a week. Then she makes a scatter plot ...
-
C720 PA wgu exam |70 questions and answers.
- Exam (elaborations) • 29 pages • 2023
- $13.99
- 1x sold
- + learn more
A company that produces motors uses the following check sheet: Why would the company use this check sheet? To create a control chart to measure the engine assembly process To create a flow chart of the engine assembly process To develop a suppliers, inputs, process, outputs, customers (SIPOC) diagram To develop a Pareto chart identifying the root causes of engine defects To develop a Pareto chart identifying the root causes of engine defects Which aspect of quality is demonstrated...

Too much month left at the end of the money?

-
IAAO 300: Complete Course Review Questions and Answers 100% Pass
- Exam (elaborations) • 10 pages • 2023
- $9.99
- 4x sold
- + learn more
IAAO 300: Complete Course Review Questions and Answers 100% Pass What is the main difference between single property appraisal and mass appraisal? 1. Group vs Particular 2. Mass Appraisal emphasizes standardized and statistical quality control features In the Appraisal Process, "Define the valuation problem" does not include which of the following: a. Define the Value to be developed b. Identify limiting conditions or limitations c. Date of the value d. Competitive properties e. Identify...
-
MATH 225N Week 8 Assignment Linear Regression Equations | Questions and Answer elaborations | Already GRADED A
- Exam (elaborations) • 30 pages • 2022
- $10.99
- 1x sold
- + learn more
Question: Annie owns a tutoring service. For each tutoring session, she charges $75 plus $35 per hour of work. A linear equation that expresses the total amount of money Annie earns per tutoring sessi on is y=75+35x. What are the independent and dependent variables? What is the y-intercept and the slope? Question: George is an avid plant lover and is concerned about the lack of daffodils that grow in his backyard. He finds the growth of the daffodils, G, is dependent on the percent of aluminum m...
-
C723 Quantitative Analysis for Business- Final WGU Questions With Complete Solutions.
- Exam (elaborations) • 5 pages • 2023
- $7.29
- 1x sold
- + learn more
Hypothesis - is an assumption about a population parameter such as a mean or a proportion null hypothesis (H0) - -represents the status quo -states a belief that the population parameter is ≤, =, or ≥ a specific value -believed to be true unless there is overwhelming evidence to the contrary alternative hypothesis (H1) - -represents the opposite of the null hypothesis -believed to be true if the null hypothesis is found to be false -always states that the population parameter is >, ...
-
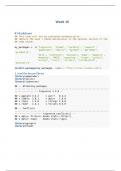
The_broom_Package_VisualAnalytics_Week10_NEC_Solved
- Exam (elaborations) • 9 pages • 2023
- $10.49
- 1x sold
- + learn more
1. load the broom library 2. use tidy() on the out dataframe to produce a new dataframe of component level information. Store the result in out_comp. 3. round all the columns to two decimal places using round_df(). 4. Produce a flipped scatter plot of Term v. Estimate 5. Produce a new tidy output of out including confidence intervals. Store it in a variable called out_conf after rounding the dataframe to two decimals. 6. Remove the intercept column and the term continent from the label and ...
-
Business Statistics and Analytics in Practice 9th Edition Bowerman Test Bank
- Exam (elaborations) • 1963 pages • 2022
- $16.73
- 2x sold
- + learn more
Student name:__________ TRUE/FALSE - Write 'T' if the statement is true and 'F' if the statement is false. 1) A stem-and-leaf display is a graphical portrayal of a data set that shows the data set's overall pattern of variation. ⊚ true ⊚ false 2) The relative frequency is the frequency of a class divided by the total number of measurements. ⊚ true ⊚ false 3) A bar chart is a graphic that can be used to depict qualitative data. ⊚ true ⊚ false 4) Stem-and-leaf displays and dot plo...
