Mathematics, statistics
University of lahore
All 5 results
Sort by
-
Week 7 Assignment: Analyze Samples, Power Analysis, and Design Sensitivity
- Answers • 3 pages • 2020
- $12.49
- + learn more
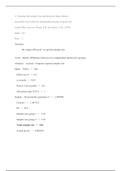
. Calculate the sample size needed given these factors: one-tailed t-test with two independent groups of equal size small effect size (see Piasta, S.B., & Justice, L.M., 2010) alpha =.05 beta = .2 Assume that the result is a sample size beyond what you can obtain. Use the compromise function to compute alpha and beta for a sample half the size. Indicate the resulting alpha and beta. Present an argument that your study is worth doing with the smaller sample. 2. Calculate the sample size needed g...
-
STAT 200 Week 4 Homework
- Answers • 15 pages • 2020
- $14.49
- + learn more
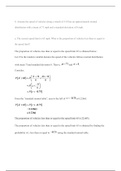
8. Assume the speed of vehicles along a stretch of I-10 has an approximately normal distribution with a mean of 71 mph and a standard deviation of 8 mph. a. The current speed limit is 65 mph. What is the proportion of vehicles less than or equal to the speed limit? b. What proportion of the vehicles would be going less than 50 mph? c. A new speed limit will be initiated such that approximately 10% of vehicles will be over the speed limit. What is the new speed limit based on this criterion? d...
-
STAT230 QUIZ 1
- Answers • 2 pages • 2020
- $6.49
- + learn more
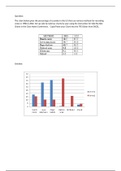
The chart below gives the percentage of counties in the US that use various methods for recording votes in 1980 & 2002. Set up side-by-side bar charts by year using the instruction for Side-By-Side Charts in the Class Notes Conference. Copy/Paste your Chart into the TFE Editor from EXCEL. METHOD 1980 2002 Punch cards 18.5 15.5 Lever machines 36.7 10.6 Paper ballots 40.7 10.5 Optical scan 0.8 43.0 Electronic 0.2 16.3 Mixed 3.1 4.1
-
STAT230 QUIZ 1
- Answers • 3 pages • 2020
- $7.49
- + learn more
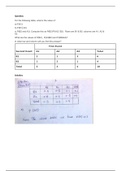
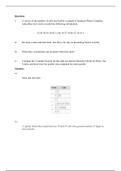
For the following table, what is the value of : a) P(A1) b) P(B1│A2) c) P(B2 and A3). Compute this as P(B2)*P(A3│ B2) . Rows are B1 & B2: columns are A1, A2 & A3. What are the values of P(B2) , P(A3|B2) and P(B2&A3)? In what row and column will you find this answer? Second Event First Event A1 A2 A3 Total B1 2 1 3 6 B2 1 2 1 4 Total 3 3 4 10
-
STAT230 QUIZ 1
- Answers • 2 pages • 2020
- $6.99
- + learn more
1. A survey of the number of calls received by a sample of Southern Phone Company subscribers last week revealed the following information. 52 43 30 38 30 42 12 46 39 37 34 46 32 18 41 5 a) Develop a stem-and-leaf chart. See above for tips on presenting Stem-Leaf plot. b) What basic conclusions can be drawn from this chart? c) Compute the 5 number System for this data set and list Xmin,Q1,Q2,Q3 & Xmax. See Videos and show how the pointer was computed for each quartile.

As you read this, a fellow student has made another $4.70

