ACFS Study guides, Class notes & Summaries
Looking for the best study guides, study notes and summaries about ACFS? On this page you'll find 5 study documents about ACFS.
All 5 results
Sort by
-
BIO 242 FINAL EXAM MACFS Questions with Complete Solutions.
- Exam (elaborations) • 15 pages • 2024
- $12.99
- + learn more
BIO 242 FINAL EXAM MACFS Questions with Complete Solutions.

-
BIO 242 FINAL EXAM MACFS Questions with Complete Solutions.
- Exam (elaborations) • 15 pages • 2024
- $14.99
- + learn more
BIO 242 FINAL EXAM MACFS Questions with Complete Solutions.
-
PCACFSS WORKER TRAINING ACTUAL EXAM QUESTIONS AND ANSWERS.
- Exam (elaborations) • 12 pages • 2024
- $14.49
- + learn more
PCACFSS WORKER TRAINING ACTUAL EXAM QUESTIONS AND ANSWERS.
-
Chapter4_solutions University of Alabama EC 410
- Exam (elaborations) • 21 pages • 2023
- $11.49
- + learn more
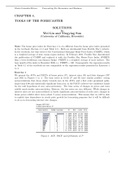
CHAPTER 4. TOOLS OF THE FORECASTER SOLUTIONS by Wei Lin and Yingying Sun (University of California, Riverside) Note: The house price index for Exercises 1 to 4 is different from the house price index presented in the textbook (Section 4.1.1 and Table 4.1). Both are downloaded from Freddie Mac’s website. In the textbook, the time series is the Conventional Mortgage Home Price Index (CMHPI), which is a weighted average of nine census region indexes. In February 2011, Freddie Mac discont...
-
Chapter5 UNDERSTANDING LINEAR DEPENDENCE: A LINK TO ECONOMIC MODELS_solutions University of Alabama EC 410
- Exam (elaborations) • 15 pages • 2023
- $11.49
- + learn more
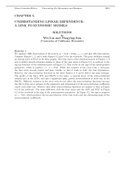
CHAPTER 5. UNDERSTANDING LINEAR DEPENDENCE: A LINK TO ECONOMIC MODELS SOLUTIONS by Wei Lin and Yingying Sun (University of California, Riverside) Exercise 1 We simulate 1000 observations of the process pt = 6.43 + 0.55pt−1 + εt and plot 100 observations. Compare Figures 1, 2, and 3 with Figures 5.2 and 5.3 in the textbook. The price oscillates around an average price of $14.3 in all these graphs. The time series of the simulated prices in Figures 1, 2 and 3 exhibit smooth dynamics ...

As you read this, a fellow student has made another $4.70

