Ap statistics Guías de estudio, Notas de estudios & Resúmenes
¿Buscas las mejores guías de estudio, notas de estudio y resúmenes para Ap statistics? En esta página encontrarás 563 documentos de estudio para Ap statistics.
Libros populares 'Ap statistics'
AP Statistics Premium, 2023-2024: 9 Practice Tests + Comprehensive Review + Online Practice
Martin Sternstein
1 documentos
Martin Sternstein
1 documentos
All 563 resultados
Ordenador por
 Popular
-
8.05 AP Statistics 2- Questions and Answers Florida Virtual High School
- Examen • 3 páginas • 2023
- $7.99
- 1x vendido
- + aprende más y mejor
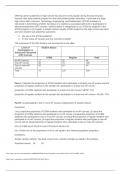
Offering career academies in high schools has become more popular during the past 30 years because they help students prepare for work and postsecondary education. A principal at a large high school with a Science, Technology, Engineering, and Mathematics (STEM) Academy is interested in determining whether the status of a student is associated with level of participation in advanced placement (AP) courses. Student status is categorized as (1) STEM for students in the STEM program or (2) reg...
 Popular
-
AP Maths Matric Notes
- Resumen • 26 páginas • 2023 Popular
- $8.78
- 1x vendido
- + aprende más y mejor
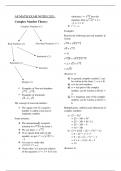
Typed and summarized IEB AP Math notes - does not include statistics notes. Includes worked examples and important concepts to note. Received a distinction in AP Maths at the end of Grade 11 due to the basis of these notes. Content includes: Complex Number Theory, Mathematical Induction, Radian Measure, Quadratic equations, Cubic Polynomials and equations, Partial fractions, Absolute Values (and graphing), Rational inequalities, Split and Composite functions, Continuity and Differentiability...
-
AP STATISTICS UNIT 5 PROGRESS CHECK MCQ PART A
- Examen • 3 páginas • 2023
- $9.99
- 1x vendido
- + aprende más y mejor
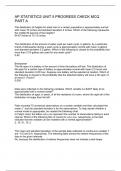
The distribution of heights for adult men in a certain population is approximately normal with mean 70 inches and standard deviation 4 inches. Which of the following represents the middle 80 percent of the heights? 64.87 inches to 75.13 inches The distribution of the amount of water used per wash cycle, in gallons, by a particular brand of dishwasher during a wash cycle is approximately normal with mean 4 gallons and standard deviation 0.2 gallon. Which of the following is closest to the p...
-
8.05 AP Statistics The Culminating Project -100% Correct Answers
- Examen • 4 páginas • 2023
- $7.99
- 1x vendido
- + aprende más y mejor
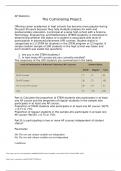
AP Statistics The Culminating Project: Offering career academies in high schools has become more popular during the past 30 years because they help students prepare for work and postsecondary education. A principal at a large high school with a Science, Technology, Engineering, and Mathematics (STEM) Academy is interested in determining whether the status of a student is associated with level of participation in advanced placement (AP) courses. Student status is categorized as (1) STEM f...
-
Bundled AP Statistics Tests Practice 2023-2024 A QUALITY SOLUTIONS
- Lote • 7 artículos • 2023
- $30.49
- 1x vendido
- + aprende más y mejor
Bundled AP Statistics Tests Practice 2023-2024 A QUALITY SOLUTIONS

Y así es como ganas dinero extra

-
AP Statistics - Unit 1 Progress Check MCQ Part A latest solution A+ QUALITY
- Examen • 3 páginas • 2023
- $10.99
- 1x vendido
- + aprende más y mejor
AP Statistics - Unit 1 Progress Check MCQ Part A latest solution A+ QUALITY The function f is given by f(x)=0.1x4−0.5x3−3.3x2+7.7x−1.99. For how many positive values of b does limx→bf(x)=2 ? - C. Three A particle is moving on the x-axis and the position of the particle at time t is given by x(t), whose graph is given above. Which of the following is the best estimate for the speed of the particle at time t=8 ? - A. 0 A rocket leaves the surface of Earth at time t=0 and ...
-
AP Statistics Exam Review Questions Multiple-Choice Questions With Complete Solutions
- Examen • 83 páginas • 2023
- $17.99
- + aprende más y mejor
AP Statistics Exam Review Questions Multiple-Choice Questions With Complete Solutions
-
AP Statistics Exam Review Questions With Complete Solutions
- Examen • 33 páginas • 2023
- $12.99
- + aprende más y mejor
What is a dotplot? correct answer: A graphical display which shows "dots" for each point. It's good for categorical data- ie data classified into categories. What's the difference between categorical and quantitative data? correct answer: Categorical data fits into various categories; whereas, quantitative data has numerical values associated with it. What is a bar chart? correct answer: A display for categorical data which indicates frequencies or percents for each category. Wha...
-
AP Statistics Exam Study Guide Questions With Complete Solutions
- Examen • 33 páginas • 2023
- $12.99
- + aprende más y mejor
How is a population measured? correct answer: a population is measured by a census. How is a sample measured? correct answer: A sample is measured using a sampling technique, of which there are several. Why do we often measure samples instead of populations? correct answer: Collecting data from an entire population is often impossible, infeasible, or beyond the capability of the resources we have available. Samples can supply good estimates of the population, and are much easier to coll...
-
AP Statistics Questions And Answers With Complete Solutions
- Examen • 21 páginas • 2023
- $12.99
- + aprende más y mejor
5 number summary correct answer: The minumum value, lower quartile, median, upper quartile, and maximum value for a data set. These five values give a summary of the shape of the distribution and are used to make box plots. The five numbers that help describe the center, spread and shape of data z score correct answer: a measure of how many standard deviations you are away from the norm (average or mean) -Number of standard deviations a score is above or below the mean (positive...
-
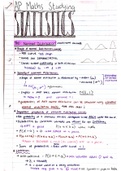
AP Maths Statistics
- Entrevista • 33 páginas • 2022
- $2.76
- 8x vendido
- + aprende más y mejor
Detailed Notes on Statistics based on the IEB AP Maths syllabus
