Dat 565 week 1 data Study guides, Class notes & Summaries
Looking for the best study guides, study notes and summaries about Dat 565 week 1 data? On this page you'll find 4 study documents about Dat 565 week 1 data.
All 4 results
Sort by
-
DAT 565 Week 1 Data, Information, and Industry Trends
- Exam (elaborations) • 7 pages • 2023
- $12.49
- + learn more
DAT 565 Week 1 Data, Information, and Industry Trends
-
DAT565 Week 1 Apply.docx DAT/565 Data Analysis and Business Analytics Week 1 Apply: Statistical Analysis Statistical Analysis: Pasta R Us ï‚·Calculate the mean, standard deviation, skew, 5-number summary, and interquartile range (IQR) for each of
- Summary • 3 pages • 2021
- $7.49
- 11x sold
- + learn more
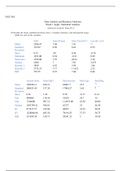
DAT565 Week 1 A DAT/565 Data Analysis and Business Analytics Week 1 Apply: Statistical Analysis Statistical Analysis: Pasta R Us ï‚·Calculate the mean, standard deviation, skew, 5-number summary, and interquartile range (IQR) for each of the variables. Mean SqFt 2580.47 Sales/Person 7.04 Sales Growth % 7.41 Loyalty Card % 2.03 Standard Deviation 374.92 0.3

-
week 2 Apply Signature Assignment Statistical Report.docx DAT/565 Apply: Signature Assignment: Statistical Report DAT/565: Data Analysis and Business Analytics Section 1: Scope and Descriptive Statistics Pastas R Us, Inc thought of creating a loyal
- Summary • 6 pages • 2021
- $7.49
- 7x sold
- + learn more
week 2 Apply Signature Assignment Statistical R DAT/565 Apply: Signature Assignment: Statistical Report DAT/565: Data Analysis and Business Analytics Section 1: Scope and Descriptive Statistics Pastas R Us, Inc thought of creating a loyalty card to incentivize customers to return more often to their establishments. Their marketing plan aimed at rolling out a loyalty card strategy to increase sales. "Under this program, customers present their loyalty card when paying for their orders and...

-
week 1 Apply Statistics Analysis.docx Apply: Statistics Analysis 1 Apply: Statistics Analysis DAT/565: Data Analysis and Business Analytics
- Summary • 4 pages • 2021
- $7.49
- 3x sold
- + learn more
week 1 Apply Statistics A Apply: Statistics Analysis 1 Apply: Statistics Analysis DAT/565: Data Analysis and Business Analytics Insert a new column in the database that corresponds to €œAnnual Sales.€ Annual Sales is the result of multiplying a restaurants €œSqFt.€ by €œSales/SqFt.€ o 2354 x 701.97 = 1,652,437.40 (SqFt x Sales/SqFt = Annual Sales) See Figure...

Fear of missing out? Then don’t!

