Math 534 week 7 Study guides, Class notes & Summaries
Looking for the best study guides, study notes and summaries about Math 534 week 7? On this page you'll find 49 study documents about Math 534 week 7.
All 49 results
Sort by
-
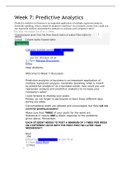
MATH 534 Week 7 Discussion Predictive Analytics
- Other • 71 pages • 2023
- $14.99
- + learn more
MATH 534 Week 7 Discussion Predictive Analytics Predictive analytics in business is an important application of multiple regression analysis.Generallyspeaking,whatismeantbypredictiveanalytics?Asabusinessowner,howcouldyouuseregressionanalysisand predictive analyticsto increase your company'ssales?
-
MATH 534 Week 7 Course Project, Final Part C_ Regression and Correlation Analysis (Keller 2023).docx
- Other • 4 pages • 2023
- $30.48
- + learn more
MATH 534 Week 7 Course Project, Final Part C_ Regression and Correlation Analysis (Keller 2023).docx

-
MATH 534 Week 7 Discussion; Predictive Analytics
- Other • 71 pages • 2023
- $15.49
- + learn more
Predictive analytics in business is an important application of multiple regression analysis.Generallyspeaking,whatismeantbypredictiveanalytics?Asabusinessowner,howcouldyouuseregressionanalysisand predictive analyticsto increase your company'ssales?
-
MATH 534 Week 7 Homework Problems
- Exam (elaborations) • 5 pages • 2023
- $19.99
- + learn more
MATH 534 Week 7 Homework Problems 1. A real estate analyst this develop da multiple regression line 2. Thefollowingisapartialcomputeroutputofamultipleregressionanalysis of a data set containing 20 sets of observations on thedependentvariable 3. Acostaccountantisdevelopingaregressionmodeltopredictthetotal cost of producing a batch of printed circuit boards as a linearfunctionofbatchsize (the numberof boardsproducedinonelotorbatch), production plant (Kingsland, and Yorktown), and producti...

-
MATH 534 Week 7 Homework Problems
- Exam (elaborations) • 5 pages • 2023
- $21.48
- + learn more
1. Question:Arealestateanalysthasdevelopedamultipleregressionline,y=60+0.068x1–2.5x2,topredicty=themarketpriceofahome(in $1,000s),usingindependentvariables,x1=thetotalnumberofsquare feetoflivingspace,andx2=theageofthehouseinyears.The regressioncoefficientofx2suggeststhis: _____. 2. Question:Thefollowingisapartialcomputeroutputofamultipleregressionanalysis of a data set containing 20 sets of observations on thedependentvariable. Theregressionequationis SALEPRIC=1470+0.8145LANDVAL+0.8204IMP...

Get paid weekly? You can!

-
MATH 534 Week 7 Course Project Final Part C Regression and Correlation Analysis
- Other • 4 pages • 2023
- $27.99
- + learn more
MATH 534 Week 7 Course Project Final Part C Regression and Correlation Analysis For this regression analysis we will choose X1-calls as Independent Variable and Y-Sales asDependentVariable.ThereasonbehinditisbecausethecorrelationcoefficientbetweenTimeandYearswith Salesisweakerthan Callswith Sales.

-
MATH 534 Week 7 Course Project, Final Part C; Regression and Correlation Analysis
- Other • 4 pages • 2023
- $25.49
- + learn more
Final Project: Regression and Correlation Analysis Use the dependent variable (labeled Y) and one of the independent variables (labeled X1, X2, and X3) in the data file. Select and use one independent variable throughout this analysis. Use Excel to perform the regression and correlation analysis to answer the following. The week 6 spreadsheet can ... helpful in this work. 1. Generate a scatterplot for the ... dependent variable (Y) and the ... independent variable (X), including the graph of t...

-
FTCE Subject Area Math Exam Questions With Verified Answers Latest 2024/2025 (100% Verified)
- Exam (elaborations) • 31 pages • 2024
- $17.49
- + learn more
FTCE Subject Area Math Exam Questions With Verified Answers 2024/2025 (100% Verified) Analyze the sample scenario to answer the following question. There were 4 frogs in the pool. Some more frogs hopped in the pool with them. Then there were 12 frogs. How many frogs joined the 4 frogs in the pool? Which of the following describes the problem structure? - ANSWER Join, result unknown Students were asked to solve the following problem using the distributive property 42 x 8. Which of the follow...

-
MATH 534 Week 7 Course Project, Final Part C; Regression and Correlation Analysis
- Other • 1 pages • 2023
- $21.48
- + learn more
Final Project: Regression and Correlation Analysis Use the dependent variable (labeled Y) and one of the independent variables (labeled X1, X2, and X3) in the data file. Select and use one independent variable throughout this analysis. Use Excel to perform the regression and correlation analysis to answer the following. The week 6 spreadsheet can ... helpful in this work. 1. Generate a scatterplot for the ... dependent variable (Y) and the ... independent variable (X), including the graph of t...

-
MATH 534 Week 7 Course Project, Final Part C; Regression and Correlation Analysis
- Other • 1 pages • 2023
- $20.48
- + learn more
Final Project: Regression and Correlation Analysis Use the dependent variable (labeled Y) and one of the independent variables (labeled X1, X2, and X3) in the data file. Select and use one independent variable throughout this analysis. Use Excel to perform the regression and correlation analysis to answer the following. The week 6 spreadsheet can ... helpful in this work. 1. Generate a scatterplot for the ... dependent variable (Y) and the ... independent variable (X), including the graph of t...
