SPSS Study guides, Class notes & Summaries
Looking for the best study guides, study notes and summaries about SPSS? On this page you'll find 131 study documents about SPSS.
Page 7 out of 131 results
Sort by
-
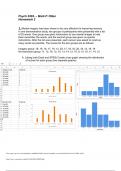
Psych 320/L - Mark P. OttenHomework 2
- Exam (elaborations) • 3 pages • 2023
- $9.79
- + learn more
Psych 320/L - Mark P. Otten Homework 2 with Graphical working from EXCEL AND SPSS

-
Data collection
- Other • 0 pages • 2023
- $7.99
- + learn more
Data is collected through Spss after the completion of research
-
HLTH 511 Quiz 1 Questions/Answers (Latest Version ) Complete Guide
- Exam (elaborations) • 3 pages • 2020
- $7.49
- 1x sold
- + learn more
HLTH 511 Quiz 1 Questions/Answers (Latest Version ) Complete Guide Question 1 Pertains to Week 1 SPSS assignment output: What percent of students took more than 20 seconds to wash their hands? Question 2 Pertains to Week 1 SPSS assignment output: Examine the frequencies across the categories for How long do you wash? Based on what you observe which of the following would best describe the shape of the distribution of data for the variable How long do you wash? Question 3 Pertains t...

-
PUBH 6033 Week2Assgn1.UchenduD.doc Walking plus strength training exercise program results Master of Public Health, Walden University PUBH 6033: Interpretation and Application of Public Health Data Instructions Hands on SPSS For this assignment, r
- Summary • 16 pages • 2022
- $7.49
- + learn more
PUBH 6033 Week2Assgn1.UchenduD.doc Walking plus strength training exercise program results Master of Public Health, Walden University PUBH 6033: Interpretation and Application of Public Health Data Instructions Hands on SPSS For this assignment, review this weeks Learning Resources, and then create and analyze frequency distributions and summary statistics of data provided as a Microsoft Excel file. Import the data into SPSS. Then run frequency distribution graphs and tables and calculat...
-
KPark_Fall_2021_SOC381L_Sociological Data Analysis_Syllabus
- Exam (elaborations) • 21 pages • 2022
- $12.99
- + learn more
SOC 381L Sociological Data Analysis Course Syllabus Fall 2021 Instructor Dr. Kiwoong Park () Class Day/Time Classroom Tues/Thurs 2:00–3:15 pm Collaborative Teaching & Learn (Room 300) Office Hours Tues/Thurs 3:30 – 4:30 pm, or by appointment (Social Science 1068) Lab Instructor Lab Class Day/Time Lab Classroom Office Hours Drew Medaris () Wed 12:00-12:50 pm Dane Smith Hall (Room 141) Thurs 10:00-11:00 am (via zoom) COURSE DESCRIPTION This course is designed to introduce a ...

Too much month left at the end of the money?

-
Using the SPSS software, open the the High School Longitudinal Study dataset
- Summary • 10 pages • 2020
- $7.49
- + learn more
Desciption summary
-
WK1AssgnSessionWillisB.docx Variables, Measurement, and SPSS RSCH 8210: Quantitative Reasoning Module 1 14:03:25 GMT -05:00 Variables, Measurement, and SPSS For this assignment, the researcher analyzed the Afrobarometer dataset. To identify the m
- Summary • 4 pages • 2022
- $7.49
- + learn more
WK1AssgnSessionWillisB.docx Variables, Measurement, and SPSS RSCH 8210: Quantitative Reasoning Module 1 14:03:25 GMT -05:00 Variables, Measurement, and SPSS For this assignment, the researcher analyzed the Afrobarometer dataset. To identify the mean of Q1 (Age), the researcher set SPSS to Variable View, selected Q1, and ran the descriptive statistics. The results displayed the mean of Q1 (Age) as 37.17. In this dataset, the researcher chose the variables Q101 (Gender of respondents) and...

-
PUBH 6033 Week2Assgn1.UchenduD.doc
- Summary • 16 pages • 2022
- $7.49
- + learn more
PUBH 6033 Week2Assgn1.UchenduD.doc Walking plus strength training exercise program results Master of Public Health, Walden University PUBH 6033: Interpretation and Application of Public Health Data Instructions Hands on SPSS For this assignment, review this weeks Learning Resources, and then create and analyze frequency distributions and summary statistics of data provided as a Microsoft Excel file. Import the data into SPSS. Then run frequency distribution graphs and tables and calculat...
-
Assessing customers' perceptions of Marketing strategies of attractions and its impacts on customer satisfaction Assignment
- Other • 53 pages • 2022
- $22.49
- + learn more
Assessing customers' perceptions of marketing strategies of attractions and its impacts on customer satisfaction assignment is about introduction, problem statement, aims and objectives, outline of the study, literature review, attractions, marketing strategies, customer satisfaction, relationship between marketing strategies and customer satisfaction, research methodology, limitations of the study, result and discussion, analysis of the 7 P's, SPSS data analysis, conclusion and recommendation...
-
PUBH 6033 Week2Assgn1.UchenduD.doc
- Summary • 16 pages • 2022
- $7.49
- + learn more
PUBH 6033 Week2Assgn1.UchenduD.doc Walking plus strength training exercise program results Master of Public Health, Walden University PUBH 6033: Interpretation and Application of Public Health Data Instructions Hands on SPSS For this assignment, review this weeks Learning Resources, and then create and analyze frequency distributions and summary statistics of data provided as a Microsoft Excel file. Import the data into SPSS. Then run frequency distribution graphs and tables and calculat...
