Mejora tus resultados de búsqueda. Selecciona tu institución educativa y materia para que podamos mostrarte los documentos más relevantes y ayudarte de la mejor manera posible.
Vale, entiendo!
Tu colegio o universidad
Mejora tus resultados de búsqueda. Selecciona tu institución educativa y materia para que podamos mostrarte los documentos más relevantes y ayudarte de la mejor manera posible.
Aquí están los mejores recursos para pasar MAT 210. Encuentra MAT 210 guías de estudio, notas, tareas, y mucho más.
All
21 resultados
Ordenador por
MAT 210 Milestone 5 EXPERT VERIFIED ANSWERS WITH RATIONALES INCLUDED. GUARANTEED A GRADE .
Examen • 22
páginas
• 2024
James participated in an archery competition. He was allowed four attempts and was
supposed to hit the bullseye in the center of the board.
If the figure shows the positions of James' arrows, which of the following would best
classify the arrangement of arrows?
● Low accuracy and high precision
● High accuracy and low precision
● High accuracy and high precision
● Low accuracy and low precision
RATIONALE
The arrows are close to the center so they are accurate and they are also ...
MAT 210 Milestone 5 EXPERT VERIFIED ANSWERS WITH RATIONALES INCLUDED. GUARANTEED A GRADE .
Última actualización de este documento:
hace
James participated in an archery competition. He was allowed four attempts and was
supposed to hit the bullseye in the center of the board.
If the figure shows the positions of James' arrows, which of the following would best
classify the arrangement of arrows?
● Low accuracy and high precision
● High accuracy and low precision
● High accuracy and high precision
● Low accuracy and low precision
RATIONALE
The arrows are close to the center so they are accurate and they are also ...
MAT 210 _MAT210_Week_3_Assignment_Template EXPERT VERIFIED ANSWERS WITH RATIONALES INCLUDED. GUARANTEED A GRADE .
Última actualización de este documento:
hace
MAT 210 _MAT210_Week_3_Assignment_Template EXPERT VERIFIED ANSWERS WITH RATIONALES INCLUDED. GUARANTEED A GRADE .
MAT 210 Assignment 1 EXPERT VERIFIED ANSWERS WITH RATIONALES INCLUDED. GUARANTEED A GRADE .
Caso • 4
páginas
• 2024
1. Explain the difference between descriptive and inferential statistical methods and give an example
of how each could help you draw a conclusion in the real world.
The key difference between descriptive and inferential statistics is the process and how the statistic for a
particular group is being studied and the conclusive evidence provided through the study. An example of
a real-world application would be a study that describes test scores in a particular class, and a graph that
shows t...
MAT 210 Assignment 1 EXPERT VERIFIED ANSWERS WITH RATIONALES INCLUDED. GUARANTEED A GRADE .
Última actualización de este documento:
hace
1. Explain the difference between descriptive and inferential statistical methods and give an example
of how each could help you draw a conclusion in the real world.
The key difference between descriptive and inferential statistics is the process and how the statistic for a
particular group is being studied and the conclusive evidence provided through the study. An example of
a real-world application would be a study that describes test scores in a particular class, and a graph that
shows t...
MAT 210 Unit 5 Milestone 5 EXPERT VERIFIED ANSWERS WITH RATIONALES INCLUDED. GUARANTEED A GRADE .
Caso • 23
páginas
• 2024
Adam tabulated the values for the average speeds on each day of his road trip as 60.5,
63.2, 54.7, 51.6, 72.3, 70.7, 67.2, and 65.4 mph. He wishes to construct a 98%
confidence interval.
What value of t* should Adam use to construct the confidence interval? Answer choices
are rounded to the thousandths place.
● 2.517
● 2.896
● 2.998
● 4.489
RATIONALE
Recall that we have n = 8, so the df = n-1 = 7. So if we go to the
row where df = 7 and then 0.01 for the tail probability, this...
MAT 210 Unit 5 Milestone 5 EXPERT VERIFIED ANSWERS WITH RATIONALES INCLUDED. GUARANTEED A GRADE .
Última actualización de este documento:
hace
Adam tabulated the values for the average speeds on each day of his road trip as 60.5,
63.2, 54.7, 51.6, 72.3, 70.7, 67.2, and 65.4 mph. He wishes to construct a 98%
confidence interval.
What value of t* should Adam use to construct the confidence interval? Answer choices
are rounded to the thousandths place.
● 2.517
● 2.896
● 2.998
● 4.489
RATIONALE
Recall that we have n = 8, so the df = n-1 = 7. So if we go to the
row where df = 7 and then 0.01 for the tail probability, this...
MAT 210 Unit 4 Milestone 4 (1) QUESTIONS AND CORRECT DETAILED ANSWERS WITH RATIONALES VERIFIED ANSWERS ALREADY GRADED A+.
Examen • 16
páginas
• 2024
Which of the following set of statements is true?
● About 94% of the variation in beach visitors is explained by a negative linear
relationship with daily temperatures.
● The correlation coefficient, r, is 0.969.
● About 94% of the variation in beach visitors can be explained by a positive linear
relationship with daily temperature.
● The correlation coefficient, r, is 0.969.
● About 94% of the variation in daily temperature can be explained by a positive
linear relationship wi...
MAT 210 Unit 4 Milestone 4 (1) QUESTIONS AND CORRECT DETAILED ANSWERS WITH RATIONALES VERIFIED ANSWERS ALREADY GRADED A+.
Última actualización de este documento:
hace
Which of the following set of statements is true?
● About 94% of the variation in beach visitors is explained by a negative linear
relationship with daily temperatures.
● The correlation coefficient, r, is 0.969.
● About 94% of the variation in beach visitors can be explained by a positive linear
relationship with daily temperature.
● The correlation coefficient, r, is 0.969.
● About 94% of the variation in daily temperature can be explained by a positive
linear relationship wi...
MAT 210 Unit 4 Milestone 4 (1) QUESTIONS AND CORRECT DETAILED ANSWERS WITH RATIONALES VERIFIED ANSWERS ALREADY GRADED A+.
Examen • 16
páginas
• 2024
Which of the following set of statements is true?
● About 94% of the variation in beach visitors is explained by a negative linear
relationship with daily temperatures.
● The correlation coefficient, r, is 0.969.
● About 94% of the variation in beach visitors can be explained by a positive linear
relationship with daily temperature.
● The correlation coefficient, r, is 0.969.
● About 94% of the variation in daily temperature can be explained by a positive
linear relationship wi...
MAT 210 Unit 4 Milestone 4 (1) QUESTIONS AND CORRECT DETAILED ANSWERS WITH RATIONALES VERIFIED ANSWERS ALREADY GRADED A+.
Última actualización de este documento:
hace
Which of the following set of statements is true?
● About 94% of the variation in beach visitors is explained by a negative linear
relationship with daily temperatures.
● The correlation coefficient, r, is 0.969.
● About 94% of the variation in beach visitors can be explained by a positive linear
relationship with daily temperature.
● The correlation coefficient, r, is 0.969.
● About 94% of the variation in daily temperature can be explained by a positive
linear relationship wi...
MAT 210 Assignment 1 QUESTIONS AND CORRECT DETAILED ANSWERS WITH RATIONALES VERIFIED ANSWERS ALREADY GRADED A+
Examen • 4
páginas
• 2024
1. Explain the difference between descriptive and inferential statistical methods and give an example
of how each could help you draw a conclusion in the real world.
The key difference between descriptive and inferential statistics is the process and how the statistic for a
particular group is being studied and the conclusive evidence provided through the study. An example of
a real-world application would be a study that describes test scores in a particular class, and a graph that
shows t...
MAT 210 Assignment 1 QUESTIONS AND CORRECT DETAILED ANSWERS WITH RATIONALES VERIFIED ANSWERS ALREADY GRADED A+
Última actualización de este documento:
hace
1. Explain the difference between descriptive and inferential statistical methods and give an example
of how each could help you draw a conclusion in the real world.
The key difference between descriptive and inferential statistics is the process and how the statistic for a
particular group is being studied and the conclusive evidence provided through the study. An example of
a real-world application would be a study that describes test scores in a particular class, and a graph that
shows t...
MAT 210 Week 3 Assignment 1: The Foundation of Data-Driven Decisions
Examen • 4
páginas
• 2024
Assignment 1: The Foundation of Data-Driven Decisions Khanal 2
1. Explain the difference between descriptive and inferential statistical methods and give an example
of how each could help you draw a conclusion in the real world.
The key difference between descriptive and inferential statistics is the process and how the statistic for a
particular group is being studied and the conclusive evidence provided through the study. An example of
a real-world application would be a study that descri...
MAT 210 Week 3 Assignment 1: The Foundation of Data-Driven Decisions
Última actualización de este documento:
hace
Assignment 1: The Foundation of Data-Driven Decisions Khanal 2
1. Explain the difference between descriptive and inferential statistical methods and give an example
of how each could help you draw a conclusion in the real world.
The key difference between descriptive and inferential statistics is the process and how the statistic for a
particular group is being studied and the conclusive evidence provided through the study. An example of
a real-world application would be a study that descri...
MAT 210 Unit 5 Milestone 5 Exam Questions with All Correct Answers
Examen • 23
páginas
• 2024
You passed this Milestone
22 questions were answered correctly.
2 questions were answered incorrectly.
1
Adam tabulated the values for the average speeds on each day of his road trip as 60.5,
63.2, 54.7, 51.6, 72.3, 70.7, 67.2, and 65.4 mph. He wishes to construct a 98%
confidence interval.
What value of t* should Adam use to construct the confidence interval? Answer choices
are rounded to the thousa
MAT 210 Unit 5 Milestone 5 Exam Questions with All Correct Answers
Última actualización de este documento:
hace
You passed this Milestone
22 questions were answered correctly.
2 questions were answered incorrectly.
1
Adam tabulated the values for the average speeds on each day of his road trip as 60.5,
63.2, 54.7, 51.6, 72.3, 70.7, 67.2, and 65.4 mph. He wishes to construct a 98%
confidence interval.
What value of t* should Adam use to construct the confidence interval? Answer choices
are rounded to the thousa
MAT 210 Unit 4 Milestone 4 (1) passed this Milestone 15 questions were answered correctly. 3 questions were answered incorrectly
Examen • 16
páginas
• 2024
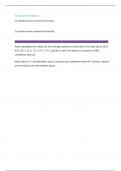
For this scatterplot, the r2 value was calculated to be 0.9382.
Which of the following set of statements is true?
● About 94% of the variation in beach visitors is explained by a negative linear
relationship with daily temperatures.
● The correlation coefficient, r, is 0.969.
● About 94% of the variation in beach visitors can be explained by a positive linear
relationship with daily temperature.
● The correlation coefficient, r, is 0.969.
● About 94% of the variation in daily t...
MAT 210 Unit 4 Milestone 4 (1) passed this Milestone 15 questions were answered correctly. 3 questions were answered incorrectly
Última actualización de este documento:
hace
For this scatterplot, the r2 value was calculated to be 0.9382.
Which of the following set of statements is true?
● About 94% of the variation in beach visitors is explained by a negative linear
relationship with daily temperatures.
● The correlation coefficient, r, is 0.969.
● About 94% of the variation in beach visitors can be explained by a positive linear
relationship with daily temperature.
● The correlation coefficient, r, is 0.969.
● About 94% of the variation in daily t...
Y así es como ganas dinero extra
¿Sabías que, de media, un vendedor en Stuvia gana 76 euros al mes con la venta de recursos de estudio? Hmm, pista, pista.
Descubre todo sobre cómo ganar en Stuvia