SPSS Study guides, Class notes & Summaries
Looking for the best study guides, study notes and summaries about SPSS? On this page you'll find 131 study documents about SPSS.
Page 4 out of 131 results
Sort by
-
PSYC 515 Module 5: Week 5 Quiz: Non-parametric Tests Concepts 2023 worth 50 points.
- Exam (elaborations) • 14 pages • 2023
- $10.99
- + learn more
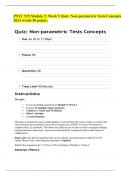
PSYC 515 Module 5: Week 5 Quiz: Non-parametric Tests Concepts 2023 worth 50 points. Quiz: Non-parametric Tests Concepts • Due Jul 30 at 11:59pm • Points 50 • Questions 26 • Time Limit 90 Minutes Instructions The quiz: • Covers the Learn material from Module 5: Week 5. • Contains 25 multiple-choice questions. • Is limited to 1 hour and 30 minutes. • Allows 1 attempt. • Is worth 50 points. This quiz is designed to assess un...

-
PSY-380 Introduction to Probability and Statistics Project 3
- Other • 11 pages • 2021
- $5.39
- 3x sold
- + learn more
PSY-380 Introduction to Probability and Statistics Project 3 – SPSS Analyses Before beginning this assignment, be sure to watch the MindTap SPSS Demonstration Library videos corresponding to each question in order to successfully complete the assignment. The videos and links are listed in the LMS assignment description and below each question. In SPSS run the correct statistical test for each study. 1. A researcher is interested to learn if there is a linear relationship between the hour...
-
Regression Lecture 4 And 5 Quiz University of Illinois, Chicago IDS 371
- Exam (elaborations) • 6 pages • 2023
- $7.99
- + learn more
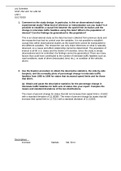
Question 1 True or False: Multicollinearity is a situation where you have NO interference among the explanatory variables for regression Selected Answer: False Answers: True False Question 2 If you have variables that are multicollinear in your regression model they are more likely to be statistically significant Selected Answer: False Answers: True False Question 3 If you have multicollinearity then the global Ftest will be less likely to be statistically significant compared to...

-
Computer Assignment Quiz Nonparametric with Correct Answers University of Illinois, Chicago IDS 371
- Exam (elaborations) • 4 pages • 2023
- $7.99
- + learn more
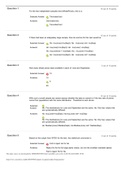
Question 1 For the two independent samples test (WheatPrices), this is a Selected Answer: Twosided test Answers: Onesided test Twosided test Question 2 If there had been an adequately large sample, then Ho and Ha for this test would be Selected Answer: Ho: mu(June)=mu(Sept); Ha: mu(June) not= mu(Sep) Answers: Ho: mu(June)=mu(Sept); Ha: mu(June) >mu(Sep) Ho: mu(June)not = mu(Sept); Ha: mu(June) =mu(Sep) Ho: mu(June)=mu(Sept); Ha: mu(June) not= mu(Sep) Question 3 How many ...
-
Computer Assignment Quiz Nonparametric with Correct Answers University of Illinois, Chicago IDS 371
- Exam (elaborations) • 4 pages • 2023
- $8.99
- + learn more
Question 1 For the two independent samples test (WheatPrices), this is a Selected Answer: Twosided test Answers: Onesided test Twosided test Question 2 If there had been an adequately large sample, then Ho and Ha for this test would be Selected Answer: Ho: mu(June)=mu(Sept); Ha: mu(June) not= mu(Sep) Answers: Ho: mu(June)=mu(Sept); Ha: mu(June) >mu(Sep) Ho: mu(June)not = mu(Sept); Ha: mu(June) =mu(Sep) Ho: mu(June)=mu(Sept); Ha: mu(June) not= mu(Sep) Question 3 How many ...

And that's how you make extra money

-
STAT 252 LAB 1 University of Alberta STAT 252 (Questions and Answers)
- Exam (elaborations) • 11 pages • 2023
- $7.99
- + learn more
1. Comment on the study design. In particular, is this an observational study or experimental study? What kind of inference or interpretation can you make? Is it possible to establish a causal link between the speed limit increases and the change in interstate traffic fatalities using this data? What is the population of interest? Can the findings be generalized to this population? This is an observational study as the data has been collected from previous study and the researcher has had ...

-
Statistics Analysis DAT 565: Data Analysis and Business Analytics
- Exam (elaborations) • 9 pages • 2022
- $7.49
- + learn more
This statistical report is based on the Pastas R Us, Inc. Database. Descriptive statistical analyses were done on the database using Excel. The statistical analysis was conducted on the Pastas R Us, Inc. Database with the main aim of determining the Descriptives of the data, as shown in the following paragraphs. Calculation of the Mean, standard deviation, skew, 5-number summary, and interquartile range (IQR) for each of the variables. The Mean, standard deviation, skew, 5-number summary, and ...
-
Edco 735 final exam econometrics, (Answered) 100%
- Exam (elaborations) • 18 pages • 2023
- $9.99
- + learn more
Edco 735 final exam econometrics, (Answered) 100% If the data for gender is coded (male = 1, female = 2, other =3,), which of the following represents a problematic score in a frequency table? (correct) 2 0 1 3 Which of the following is one of the core requirements for causal inference? (correct) ratio level of measurement qualitative data elimination of alternative explanations quantitative data No correlation could be des...
-
Example of a Quantitative Research Plan using SPSS
- Essay • 18 pages • 2022
- $3.30
- 1x sold
- + learn more
This document provides an example of a Quantitative Research Plan using SPSS. This example looks specifically at the following research question:“What is the relationship between burnout, turnover intention, and job satisfaction for nurses in Irish hospitals?”. It provides a step by step guide on how to conduct correlations, T-tests, and Anova tests on SPSS. Please note: this document is intended to be used as GUIDANCE ONLY.
-
American Public University - SOCI 332 / SOCI332 Assignment 2 2016
- Exam (elaborations) • 11 pages • 2022
- $14.49
- + learn more
American Public University - SOCI 332 / SOCI332 Assignment 2 2016 Assignment 2: Tests of Significance Throughout this assignment you will review mock studies. You will needs to follow the directions outlined in the section using SPSS and decide whether there is significance between the variables. You will need to list the five steps of hypothesis testing (as covered in the lesson for Week 6) to see how every question should be formatted. You will complete all of the problems. Be sure to ...
