SPSS Study guides, Class notes & Summaries
Looking for the best study guides, study notes and summaries about SPSS? On this page you'll find 131 study documents about SPSS.
Page 6 out of 131 results
Sort by

-
Data entries in SPSS
- Other • 0 pages • 2023
- $10.49
- + learn more
Providing data into Spss and collecting the end result of the research
-
PERFOMING DATA ANALYSIS USING IBM SPSS
- Other • 733 pages • 2022
- $8.69
- + learn more
Several topics are discussed: Obtaining, editing and saving statistical output Manipulation of Data Simple Data transformations such as visual binning Bivariate correlation Non parametric procedures for analyzing frequency data MANOVA and Discriminant function analysis
-
Class notes Statistics computer science Applied Statistics Using SPSS, Statistica, Matlab and R
- Interview • 55 pages • 2023
- $27.89
- + learn more
K
-
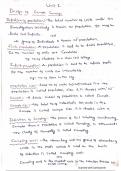
notes, exercises and exam preparation
- Class notes • 65 pages • 2023
- $8.26
- + learn more
1. Understand and utilize established ethical guidelines in conducting research. 2. Implement informed data collection procedures appropriate to a well-considered experimental design. 3. Analyze data using appropriate statistical procedures and competently use statistics software (SPSS) 4. Communicate about the methods and their application. 5. Understand, explain, and analyze One-Way ANOVA, Factorial ANOVA, and Analysis of Covariance (ANCOVA). 6. Understand, explain, and analyze Non-P...
-
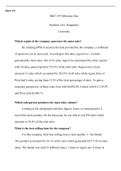
MKT 679 Milestone One..docx MKT 679 MKT 679 Milestone One Southern New Hampshire University Which region of the company generates the most sales? By utilizing SPSS to analyze the data provided by the company, a multitude of questions can be answere
- Summary • 2 pages • 2021
- $7.49
- + learn more
MKT 679 Milestone One..docx MKT 679 MKT 679 Milestone One Southern New Hampshire University Which region of the company generates the most sales? By utilizing SPSS to analyze the data provided by the company, a multitude of questions can be answered. According to this data, region two”Central”generated the most sales. Out of 43 sales, region two dominated the other regions with 24 sales, garnering them 55.81% of the total sales. Region one or East amassed 13 sales which accounted for ...

Get paid weekly? You can!

-
Statistics calculations
- Class notes • 9 pages • 2024
- $35.49
- + learn more
Gives worked examples of how to calculate multiple regression using excel, spss and TI Nspire calculator. In all the methods the coefficient of determination is identified and interpreted in relation to the dependent variable. The correlation coefficient in also determined and explained in terms of the relationship with the dependent variable.
-
6. Business Statistics in BBA (Complete Course Outline)
- Summary • 13 pages • 2023
- $2.99
- + learn more
KEYWORDS: 1. Business Statistics 2. BBA 3. Statistics for BBA 4. Business Mathematics 5. BBA Study Notes 6. Data Analysis 7. Probability Theory 8. Descriptive Statistics 9. Inferential Statistics 10. Hypothesis Testing 11. Regression Analysis 12. Statistical Methods 13. Statistical Analysis 14. Quantitative Analysis 15. Statistical Software (e.g., SPSS, Excel) 16. Probability Distributions 17. Sampling Techniques 18. Central Limit Theorem 19. Correlation and Covariance 20. Bu...
-
What Is the Association Between Education and Gender?
- Exam (elaborations) • 12 pages • 2023
- $10.49
- + learn more
Use attached dataset and prepare part 1 and part 2 with SPSS CommanderR Part 1: * Create a histogram using the job satisfaction variable (jobsat). * Create a bar chart using the education variable. * Create a boxplot using the skill variable. * Create a QQ plot using the organizational commitment variable (orgcom). Use commanderR SPSSA program and write a brief narrative explaining results should be included. Part 2: Select the appropriate test to answer this research question: Wh...
-
Edco 735 final exam econometrics, (Answered) 100%
- Exam (elaborations) • 18 pages • 2023
- $10.49
- + learn more
Edco 735 final exam econometrics, (Answered) 100% If the data for gender is coded (male = 1, female = 2, other =3,), which of the following represents a problematic score in a frequency table? (correct) 2 0 1 3 Which of the following is one of the core requirements for causal inference? (correct) ratio level of measurement qualitative data elimination of alternative explanations quantitative data No correlation could be des...
-
SPSS/ applied statistic
- Class notes • 3 pages • 2022
- $10.49
- + learn more
SPSS is a major subject for humanities, social science and psychology students.The purpose to share these documents to help students regarding their study.
