Alle 12 resultaten
Sorteer op
Meest verkochte samenvattingen voor Text Mining with R
-
TextAnalytics_Week14_NEC_solved
- Tentamen (uitwerkingen) • 14 pagina's • 2023 Populair
- $10.49
- 5x verkocht
- + meer info
Create a stacked bar chart of usenet message groups showing the number of messages in each group. Add some color to differentiate among the types (letters before the first period). Comment your code line by line. Clean the text and remove stop words. Show words by newsgroup. Apply tf-idf metric. Show stacked bar charts of word usage for 'sci' groups. Comment your code, line by line. Explore another news group in the same way. Do a pairwise correlation of words by newsgroups. Visualize the ...
-
Text_Analytics_Week12_NEC_Solved
- Tentamen (uitwerkingen) • 13 pagina's • 2023 Populair
- $10.49
- 2x verkocht
- + meer info
Using the attached files of around 3200 tweets per person, show a histogram (frequency distribution) of the tweets of both Dave and Julia. Use `UTC` to create the time stamp. Remember that the case of column headers matters. Make a dataframe of word frequency for each of Dave and Julia. Plot the frequencies against each other. Include a dividing line in red showing words nearby that are similar in frequency and words more distant which are shared less frequently. Create a stacked chart compa...

-
Text_Analytics_Week13_NEC_Solved
- Tentamen (uitwerkingen) • 19 pagina's • 2023 Populair
- $10.49
- 2x verkocht
- + meer info
Create time series charts for each tweeter showing how word usage has changed over time. Show for three words. You may have to manipulate a parameter to show Comment your code, line by line. Show a graph for each tweeter revealing the ten words with the highest number of retweets. Comment your code, line by line.
Schrijf jij zelf ook samenvattingen? Bied deze dan te koop aan en verdien per keer dat je document wordt gekocht.
-
Text_Analytics_Week11_NEC_Solved
- Tentamen (uitwerkingen) • 7 pagina's • 2023 Populair
- $10.49
- 1x verkocht
- + meer info
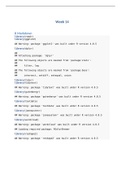
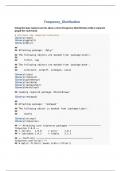
1. Show stacked bar charts of the most common terms within each of 2 topics from the Associated Press articles in the topicmodels package. Color the charts by topic. Comment your code line by line. 2. Show a stacked bar chart showing the words that have a Beta greater than 1/1000 in at least one topic with the greatest difference in Beta between topic 1 and topic 2. comment each line of your code.
-
Text_Analytics_Week10_NEC_Solved
- Tentamen (uitwerkingen) • 8 pagina's • 2023 Populair
- $10.49
- 1x verkocht
- + meer info
Create a chart showing the words with the greatest contribution to positive or negative sentiment in the AP articles. Show all the code from the necessary packages untll you can produce the chart. Comment your code line by line. Create charts showing the terms with the highest tf-idf from each of four selected inaugural addresses. Eliminate the ? term. Show all the code from the necessary packages untll you can produce the chart. Comment your code line by line. Create charts showing over time...
-
Text_Analytics_Week7_NEC_Solved
- Tentamen (uitwerkingen) • 10 pagina's • 2023 Populair
- $10.49
- 1x verkocht
- + meer info
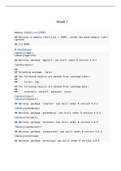
Find the most common bigrams in Wells' novels. Show a chart and your code with comments. Show tf-idf frequency in faceted graphs of Wells' novels. Determine how often the word 'not' precedes another word in Wells' novels. Show a table.
-
Text_Analytics_Week5_NEC_Solved
- Tentamen (uitwerkingen) • 53 pagina's • 2023 Populair
- $10.49
- + meer info
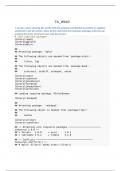
• Using the gutenbergr package, (if the default mirror doesn't work use: hgwells <- gutenberg_download(c(35,36,5230,159), mirror = " • Create bar charts of the top ten words that contribute to the positive and negative sentiment in one of the books. • Produce a Word Cloud of the 100 most common words in the same book.
-
Text_Analytics_Week6_NEC_Solved
- Tentamen (uitwerkingen) • 9 pagina's • 2023 Populair
- $10.49
- + meer info
• Using the Jane Austen novels, show a term frequency distribution with a separate graph for each book. Comment your code line by line to show what it is doing. • Examine Zipf's law for Jane Austen's novels. Create a single graph of rank v. term frequency using logarythmic scales. Comment your code line by line to show what it is doing. • Compare Austen's novels to H.G. Wells to see if they similarly use a percentage of the most common words. Produce one graph for both authors. Use c...
-
Text_Analytics_Week8_NEC_Solved
- Tentamen (uitwerkingen) • 9 pagina's • 2023 Populair
- $10.49
- + meer info
Create network graph of bigrams in a Wells' novels. Do not include stop words. Make the links darker the more common the bigram is. Use arrows at the end of the line toward the second word. Colorize the central node. Show a chart and your code with line by line comments. Create a count_bigrams function to reuse for counting bigrams in other texts. Comment your code line by line. Create a visualize_bigrams function to reuse for visualizing network graphs of other texts. Comment your code li...
-
Text_Analytics_Week4_NEC_Solved
- Tentamen (uitwerkingen) • 12 pagina's • 2023 Populair
- $10.49
- + meer info
Find another spam text file (UCI, Kaggle, etc) and compare word frequency using both bar charts scatterplots side by side. Order the bar charts from high frequency to low. Create another visualization to show the ten highest frequency words that appear in both files. Show screenshots of your work. Include comments that explain what is happening line by line.
Nieuwste samenvattingen van Text Mining with R
-
TextAnalytics_Week14_NEC_solved
- Tentamen (uitwerkingen) • 14 pagina's • 2023 Nieuw
- $10.49
- 5x verkocht
- + meer info
Create a stacked bar chart of usenet message groups showing the number of messages in each group. Add some color to differentiate among the types (letters before the first period). Comment your code line by line. Clean the text and remove stop words. Show words by newsgroup. Apply tf-idf metric. Show stacked bar charts of word usage for 'sci' groups. Comment your code, line by line. Explore another news group in the same way. Do a pairwise correlation of words by newsgroups. Visualize the ...
-
Text_Analytics_Week13_NEC_Solved
- Tentamen (uitwerkingen) • 19 pagina's • 2023 Nieuw
- $10.49
- 2x verkocht
- + meer info
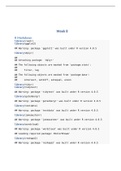
Create time series charts for each tweeter showing how word usage has changed over time. Show for three words. You may have to manipulate a parameter to show Comment your code, line by line. Show a graph for each tweeter revealing the ten words with the highest number of retweets. Comment your code, line by line.
-
Text_Analytics_Week12_NEC_Solved
- Tentamen (uitwerkingen) • 13 pagina's • 2023 Nieuw
- $10.49
- 2x verkocht
- + meer info
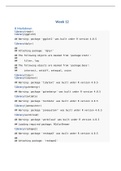
Using the attached files of around 3200 tweets per person, show a histogram (frequency distribution) of the tweets of both Dave and Julia. Use `UTC` to create the time stamp. Remember that the case of column headers matters. Make a dataframe of word frequency for each of Dave and Julia. Plot the frequencies against each other. Include a dividing line in red showing words nearby that are similar in frequency and words more distant which are shared less frequently. Create a stacked chart compa...
Schrijf jij zelf ook samenvattingen? Bied deze dan te koop aan en verdien per keer dat je document wordt gekocht.
-
Text_Analytics_Week7_NEC_Solved
- Tentamen (uitwerkingen) • 10 pagina's • 2023 Nieuw
- $10.49
- 1x verkocht
- + meer info
Find the most common bigrams in Wells' novels. Show a chart and your code with comments. Show tf-idf frequency in faceted graphs of Wells' novels. Determine how often the word 'not' precedes another word in Wells' novels. Show a table.
-
Text_Analytics_Week10_NEC_Solved
- Tentamen (uitwerkingen) • 8 pagina's • 2023 Nieuw
- $10.49
- 1x verkocht
- + meer info
Create a chart showing the words with the greatest contribution to positive or negative sentiment in the AP articles. Show all the code from the necessary packages untll you can produce the chart. Comment your code line by line. Create charts showing the terms with the highest tf-idf from each of four selected inaugural addresses. Eliminate the ? term. Show all the code from the necessary packages untll you can produce the chart. Comment your code line by line. Create charts showing over time...
-
Text_Analytics_Week11_NEC_Solved
- Tentamen (uitwerkingen) • 7 pagina's • 2023 Nieuw
- $10.49
- 1x verkocht
- + meer info
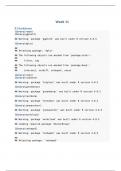
1. Show stacked bar charts of the most common terms within each of 2 topics from the Associated Press articles in the topicmodels package. Color the charts by topic. Comment your code line by line. 2. Show a stacked bar chart showing the words that have a Beta greater than 1/1000 in at least one topic with the greatest difference in Beta between topic 1 and topic 2. comment each line of your code.
-
Text_Analytics_Week5_NEC_Solved
- Tentamen (uitwerkingen) • 53 pagina's • 2023 Nieuw
- $10.49
- + meer info
• Using the gutenbergr package, (if the default mirror doesn't work use: hgwells <- gutenberg_download(c(35,36,5230,159), mirror = " • Create bar charts of the top ten words that contribute to the positive and negative sentiment in one of the books. • Produce a Word Cloud of the 100 most common words in the same book.
-
Text_Analytics_Week4_NEC_Solved
- Tentamen (uitwerkingen) • 12 pagina's • 2023 Nieuw
- $10.49
- + meer info
Find another spam text file (UCI, Kaggle, etc) and compare word frequency using both bar charts scatterplots side by side. Order the bar charts from high frequency to low. Create another visualization to show the ten highest frequency words that appear in both files. Show screenshots of your work. Include comments that explain what is happening line by line.
-
Text_Analytics_Week8_NEC_Solved
- Tentamen (uitwerkingen) • 9 pagina's • 2023 Nieuw
- $10.49
- + meer info
Create network graph of bigrams in a Wells' novels. Do not include stop words. Make the links darker the more common the bigram is. Use arrows at the end of the line toward the second word. Colorize the central node. Show a chart and your code with line by line comments. Create a count_bigrams function to reuse for counting bigrams in other texts. Comment your code line by line. Create a visualize_bigrams function to reuse for visualizing network graphs of other texts. Comment your code li...
-
Text_Analytics_Week6_NEC_Solved
- Tentamen (uitwerkingen) • 9 pagina's • 2023 Nieuw
- $10.49
- + meer info
• Using the Jane Austen novels, show a term frequency distribution with a separate graph for each book. Comment your code line by line to show what it is doing. • Examine Zipf's law for Jane Austen's novels. Create a single graph of rank v. term frequency using logarythmic scales. Comment your code line by line to show what it is doing. • Compare Austen's novels to H.G. Wells to see if they similarly use a percentage of the most common words. Produce one graph for both authors. Use c...
