Exam (elaborations)
Drawing_Maps_VisualAnalytics_Week14_NEC_Solved
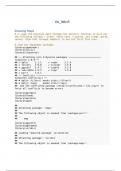
1. pipe the election data through the select() function to pick out the following columns - state, total_vote, r_points, pct_trump, party, census. Pipe that through sample() to see the first five rows. 2. Create a state level dotplot of election data except the District of Columbia faceted by reg...
[Show more]