ECON 110 (ECON110)
Wesleyan University
All 12 results
Sort by
-
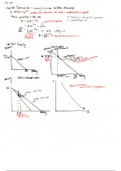
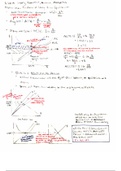
Capital Markets
- Class notes • 2 pages • 2019
- $7.49
- + learn more
-
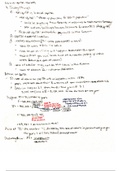
Definitions of Capital
- Class notes • 1 pages • 2019
- $7.49
- + learn more
Defines capital and what makes it difficult to understand, as well as how returns on capital work
-
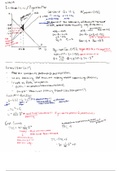
Labor Supply
- Textbook notes • 2 pages • 2019
- $7.49
- + learn more
Describes another way to find labor demand. Talks about different labor supply curves and why they exist.
-
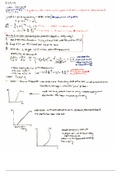
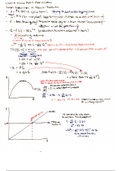
Labor Demand
- Class notes • 2 pages • 2019
- $7.49
- + learn more
Shows a mathematical example of a monopoly. It also describes multiple ways to find labor demand given the production function.
-
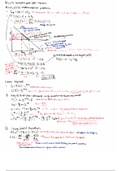
Long Run Supply and Demand
- Class notes • 3 pages • 2019
- $7.49
- + learn more
Explores what happens in a labor market long term: ie, what causes changes once a short term equilibrium has been reached.

Get paid weekly? You can!

-
Firms Profit Maximizations
- Class notes • 3 pages • 2019
- $7.49
- + learn more
A mathematical example showing how a firm maximizes profits from its production function. Uses simple calculus (one derivative). The problem is about a fisherman who employs himself and has some fixed and variable costs.
-
Production Functions and Cost Curces
- Class notes • 2 pages • 2019
- $7.49
- + learn more
Introduces different types of cost curves as well as the production function. A little information on externalities.
-
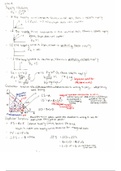
Tariffs, Subsidies, and Externalities
- Class notes • 2 pages • 2019
- $7.49
- + learn more
Models government subsidies, tariffs, and externalities. Second page is a little blurry but still legible.
-
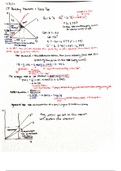
Taxes and Tariffs
- Class notes • 2 pages • 2019
- $7.49
- + learn more
Shows mathematical examples of both a sales tax and a tariff. Includes graphs
-
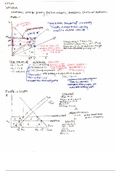
Consumer and Producer Surplus; Price Controls
- Class notes • 2 pages • 2019
- $7.49
- + learn more
This document defines consumer and producer surplus, showing it on a graph and giving mathematical examples. It has a description of supply elasticity on a graph. It also shows the effects of government price controls on a graph, as well as showing a graph of a tax.
