Visualization Study guides, Class notes & Summaries
Looking for the best study guides, study notes and summaries about Visualization? On this page you'll find 7301 study documents about Visualization.
Page 4 out of 7.301 results
Sort by
-
WGU D491 Introduction to Analytics Actual Questions and Answers 100% Correct What is Data analytics? -The process of encrypting data to keep it secure -The process of storing data in a secure location for future use -The process of analyzing data to ext
- Exam (elaborations) • 52 pages • 2024
- $20.49
- 1x sold
- + learn more
WGU D491 Introduction to Analytics Actual Questions and Answers 100% Correct What is Data analytics? -The process of encrypting data to keep it secure -The process of storing data in a secure location for future use -The process of analyzing data to extract insights -The process of collecting data from various sources Ans- The process of analyzing data to extract insights. (Data analytics involves analyzing data to extract insights and inform decision-making. This includes using vario...
-
Test Bank for Business Intelligence, Analytics, Data Science, and AI, 5th edition by Sharda
- Exam (elaborations) • 169 pages • 2023
- $39.49
- 1x sold
- + learn more
Test Bank for Business Intelligence, Analytics, Data Science, and AI, 5th edition 5e by Ramesh Sharda, Dursun Delen, Efraim Turban. Full Chapters test bank are included - Chapter 1 - 11 An Overview of Business Intelligence, Analytics, Data Science, and AI Artificial Intelligence: Concepts, Drivers, Major Technologies, and Business Applications Descriptive Analytics I: Nature of Data, Big Data, and Statistical Modeling Descriptive Analytics II: Business Intelligence Data Warehousing, and Vi...
-
DATA VISUALIZATION IN PYTHON | DS100-1 WS 2.6
- Exam (elaborations) • 9 pages • 2023
- $18.49
- + learn more
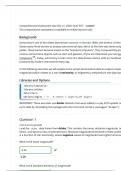
DATA VISUALIZATION IN PYTHON | DS100-1 WS 2.6. Write codes in Jupyter notebook as required by the problems. Copy both code and output as screen grab or screen shot and paste them here. Be sure to apply the necessary customizations. 1 Import gdp_. Use matplotlib to show the increase in GDP each year. Code and Output Use the previous import to prepare another plot (in red) showing only the years 2001 to 2010. Code and Output
-
TEST BANK/Solution Manual for Analytics, Data Science, & Artificial Intelligence: Systems for Decision Support 11 Edition ISBN 9780135172940, 0135172942 by Ramesh Sharda, Dursun Delen and Efraim Turban. All14 Chapters Updated
- Exam (elaborations) • 126 pages • 2023
- $17.49
- 1x sold
- + learn more
TEST BANK/Solution Manual for Analytics, Data Science, & Artificial Intelligence: Systems for Decision Support 11 Edition ISBN 9780135172940, 0135172942 by Ramesh Sharda, Dursun Delen and Efraim Turban. All14 Chapters Updated TABLE OF CONTENT PART I: INTRODUCTION TO ANALYTICS AND AI 1. An Overview of Business Analytics, Decision Support Systems, Business Intelligence, Data Science, and Artificial Intelligence 2. Artificial Intelligence: Concepts, Drivers, Major Technologies, and Business Applica...
-
NUR 200 Final Exam Questions And Answers!!
- Exam (elaborations) • 27 pages • 2024
- $7.99
- 1x sold
- + learn more
During which of the five steps in the nursing process does the nurse determine whether outcomes of care are achieved? a. Implementation b. Evaluation c. Planning d. Analysis - Answer-b. Evaluation Which statement is related to the concept that is central to the nursing process? a. It is dynamic rather than static b. It focuses on the role of the nurse c. It moves from the simple to the complex d. It is based on the patient's medical problem - Answer-a. It is dynamic rather than static...

Want to regain your expenses?

-
Splunk - Visualizations Quiz (2022/2023) (Passed with 100%)
- Exam (elaborations) • 7 pages • 2024
- $13.29
- + learn more
Which argument can be used with the timechart command to specify the time range to use when grouping events? (A) range (B) timespan (C) span (D) timerange (C) span In a single series data table, which column provides the x-axis values for a visualization? (A) The first column (B) The third column (C) The fourth column (D) The second column (A) The first column Which argument can be used with the geostats command to control the column count?
-
Solutions for Fundamentals of Python, First Programs, 3rd Edition Lambert (All Chapters included)
- Exam (elaborations) • 466 pages • 2024
- $39.49
- 1x sold
- + learn more
Complete Solutions Manual for Fundamentals of Python, First Programs, 3rd Edition by Kenneth A. Lambert ; ISBN13: 9780357881019. (Full Chapters included Chapter 1 to 13)....1. Introduction. 2. Data Types and Expressions. 3. Control Statements. 4. Strings and Text Files. 5. Lists and Dictionaries. 6. Design with Functions. 7. Design with Recursion. 8. Simple Graphics and Image Processing. 9. Graphical User Interfaces. 10. Design with Classes. 11. Data Analysis and Visualization. 12. Ne...
-
GISP 3: Cartography & Visualization questions with correct answers|100% verified|18 pages
- Exam (elaborations) • 18 pages • 2024
- $12.99
- + learn more
GISP 3: Cartography & Visualization questions with correct answers Dot map Correct Answer--Uses uniform point symbols to show partial data, with each symbol representing a unit value -Create a visual impression of density by placing a dot or some other symbol in the approximate location of the variable being mapped. Are most larger scale print maps 2D or 3D? Correct Answer-2D TIN (Triangulated Irregular Network) Correct Answer-a vector terrain model that allows for non-equally spaced ele...
-
Data Visualization Exam Summer 2023
- Exam (elaborations) • 9 pages • 2023
- $8.49
- + learn more
Data Visualization Exam Summer 2023...
-
DATA SCIEN 125 Assessment Part 1_ Properties of Stars _ Comprehensive Assessment _ Data Science_ Visualization.
- Exam (elaborations) • 5 pages • 2024
- $10.99
- + learn more
DATA SCIEN 125 Assessment Part 1_ Properties of Stars _ Comprehensive Assessment _ Data Science_ Visualization.
