Math302 week 2 Samenvattingen, Aantekeningen en Examens
Op zoek naar een samenvatting over Math302 week 2? Op deze pagina vind je 53 samenvattingen over Math302 week 2.
Alle 53 resultaten
Sorteer op

-
MATH302 Week 2 Test
- Overig • 19 pagina's • 2023
- $35.99
- + meer info
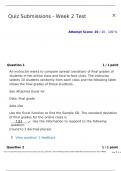
1. Question: An instructor wants to compare spread (variation) of final grades of students in her online class and face-to-face class. The instructor selects 10 students randomly from each class and the following table shows the final grades of those students. See Attached Excel for Data. 2. Question: The lengths (in kilometers) of rivers on the South Island of New Zealand that flow to the Tasman Sea are listed below. Find the variance. See Attached Excel for Data. Use the Excel function to fin...

-
MATH302 Week 2 Test
- Tentamen (uitwerkingen) • 19 pagina's • 2023
- $34.99
- + meer info
1. Question: "Number of times per week" is what type of data in the scenario? A study was done to determine the age, the number of times per week, and the duration (amount of time) of residents using a local gym in San Antonio, Texas. The first car in the parking lot was selected randomly, and then the resident of every eighth car in the lot around the gym was interviewed. 2. Question: What is the sampling method used in the following scenario? The barista at a local Starbucks wants to determ...

-
MATH302 Week 2 Test
- Tentamen (uitwerkingen) • 19 pagina's • 2023
- $34.99
- + meer info
1. Question: An instructor wants to compare spread (variation) of final grades of students in her online class and face-to-face class. The instructor selects 10 students randomly from each class and the following table shows the final grades of those students. See Attached Excel for Data. 2. Question: The lengths (in kilometers) of rivers on the South Island of New Zealand that flow to the Tasman Sea are listed below. Find the variance. See Attached Excel for Data. Use the Excel function to fin...
-
MATH302 Week 2 Test
- Tentamen (uitwerkingen) • 19 pagina's • 2023
- $22.49
- + meer info
1. Question: An instructor wants to compare spread (variation) of final grades of students in her online class and face-to-face class. The instructor selects 10 students randomly from each class and the following table shows the final grades of those students. See Attached Excel for Data. 2. Question: The lengths (in kilometers) of rivers on the South Island of New Zealand that flow to the Tasman Sea are listed below. Find the variance. See Attached Excel for Data. Use the Excel function to fin...

-
MATH302 Week 2 Test
- Tentamen (uitwerkingen) • 19 pagina's • 2023
- $28.49
- + meer info
1. Question: An instructor wants to compare spread (variation) of final grades of students in her online class and face-to-face class. The instructor selects 10 students randomly from each class and the following table shows the final grades of those students. See Attached Excel for Data. 2. Question: The lengths (in kilometers) of rivers on the South Island of New Zealand that flow to the Tasman Sea are listed below. Find the variance. See Attached Excel for Data. Use the Excel function to fin...


-
MATH302 Week 2 Test
- Tentamen (uitwerkingen) • 19 pagina's • 2023
- $29.49
- + meer info
1. Question: An instructor wants to compare spread (variation) of final grades of students in her online class and face-to-face class. The instructor selects 10 students randomly from each class and the following table shows the final grades of those students. See Attached Excel for Data. 2. Question: The lengths (in kilometers) of rivers on the South Island of New Zealand that flow to the Tasman Sea are listed below. Find the variance. See Attached Excel for Data. Use the Excel function to fin...

-
MATH302 Week 2 Test Questions and Answers APU
- Tentamen (uitwerkingen) • 19 pagina's • 2024
- $29.99
- + meer info
1. Question: An instructor wants to compare spread (variation) of final grades of students in her online class and face-to-face class. The instructor selects 10 students randomly from each class and the following table shows the final grades of those students. See Attached Excel for Data. 2. Question: The lengths (in kilometers) of rivers on the South Island of New Zealand that flow to the Tasman Sea are listed below. Find the variance. See Attached Excel for Data. Use the Excel function to fin...

-
MATH302 Week 2 Knowledge Check Homework Practice Questions
- Tentamen (uitwerkingen) • 10 pagina's • 2023
- $35.99
- + meer info
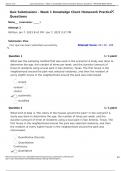
1. Question: What was the sampling method that was used in the scenario? A study was done to determine the age, the number of times per week, and the duration (amount of time) of residents using a local park in San Antonio, Texas. The first house in the neighborhood around the park was selected randomly, and then the resident of every eighth house in the neighborhood around the park was interviewed. 2. Question: What kind of data is "the colors of the houses around the park" in the scenario? ...
-
MATH302 Week 2 Knowledge Check Homework Practice Questions
- Tentamen (uitwerkingen) • 10 pagina's • 2023
- $34.99
- + meer info
1. Question: What was the sampling method that was used in the scenario? A study was done to determine the age, the number of times per week, and the duration (amount of time) of residents using a local park in San Antonio, Texas. The first house in the neighborhood around the park was selected randomly, and then the resident of every eighth house in the neighborhood around the park was interviewed. 2. Question: What kind of data is "the colors of the houses around the park" in the scenario? ...

-
MATH302 Week 2 Knowledge Check Homework Practice Questions
- Tentamen (uitwerkingen) • 10 pagina's • 2024
- $24.99
- + meer info
1. Question: What was the sampling method that was used in the scenario? A study was done to determine the age, the number of times per week, and the duration (amount of time) of residents using a local park in San Antonio, Texas. The first house in the neighborhood around the park was selected randomly, and then the resident of every eighth house in the neighborhood around the park was interviewed. 2. Question: What kind of data is "the colors of the houses around the park" in the scenario? ...
